Latest Covid-19 data shows more decreases around Leamington, Kenilworth and Warwick - but one new ward has moved into the 'high band'
and live on Freeview channel 276
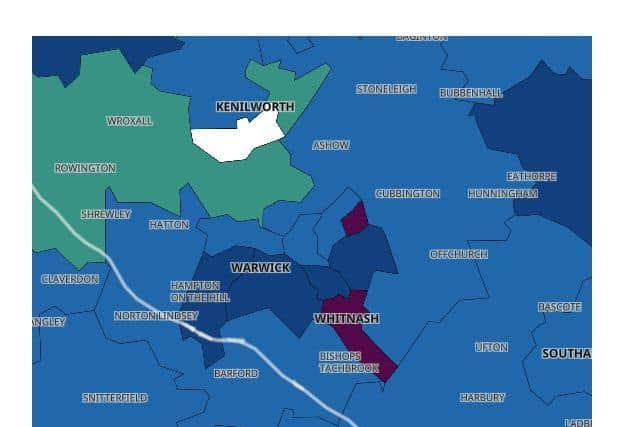
This week's Covid-19 data shows more decreases of positive cases in wards around Leamington, Kenilworth and Warwick.
And while Whitnash has now moved into the Government's 'high band' - areas with a high rolling rate of above 400 - two wards have moved out of that band.
Advertisement
Hide AdAdvertisement
Hide AdThat means the Warwick district now has two wards in the high band - Whitnash (417.8 per 100,000) and Lillington (565.8 per 100,000).

The data is collected by the Government for the week up to November 17.
Seven–day rates are expressed per 100,000 population and are calculated by dividing the seven day count by the area population and multiplying by 100,000.
Overall, the Warwick district has a seen a decrease or the week up to November 17, with 315 new cases - a decrease of 85 (-21.3%). This means the district has an overall seven day rolling rate of 219.1 per 100,000.
Advertisement
Hide AdAdvertisement
Hide AdIt is worth noting that some figures may have been altered by changes to how students are counted - click here to read our article about that.
Last week, Leamington Central and North, Lillington and Brunswick were all in the high band, but this week Leamington Central and North and Brunswick have seen significant decreases in the infection rates.
Brunswick still has a high rolling rate above the national average but it has fallen enough for it to move out of the high band.
Leamington Central and North's decrease has seen its rolling average fall below the national average.
Advertisement
Hide AdAdvertisement
Hide AdLillington's data has stayed the same as last week but it does have the highest rate per 100,000 people in the district - 565.8.
In Warwick, there have been an increase of 13 new cases in the Warwick South, Myton and Heathcote ward but decreases in the Warwick South West and Aylesford ward and the Warwick North ward.
In Kenilworth, there have been decreases in Kenilworth West and Kenilworth West but the data for Kenilworth South is not available.
Highest rolling rates in the Warwick district
(Seven–day rates are expressed per 100,000 population and are calculated by dividing the seven day count by the area population and multiplying by 100,000)
Lillington: 565.8 (above the national average)
Whitnash: 417.8 (above the national average)
Leamington Brunswick: 356.6 (above the national average)
Advertisement
Hide AdAdvertisement
Hide AdHere is the data for the areas that have been the big changes:
Leamington Brunswick
Cases over seven days up to November 17th: 39
This is a decrease of 19 (32.8%) compared to the previous week
The area has a rolling rate of 356.6 which is above the national average.
Leamington Central and North
Cases over seven days up to November 17th: 20
This is a decrease of 36 (64.3%) compared to the previous week
Advertisement
Hide AdAdvertisement
Hide AdThe area has a rolling rate of 146.6 which is below the national average
Leamington East and Sydenham
Cases over seven days up to November 17th: 31
This is a decrease of 10 (24.4%) compared to the previous week.
The area has a rolling rate of 279.8 which is above the national average
Whitnash
Cases over seven days up to November 17th: 41
This is an increase of 14 (51.9%) compared to the previous week.
The area has a rolling rate of 417.8 which is above the national average